

Tyto Robotics, a developer of high-precision testing solutions for UAVs and drones, conducted a series of wind tunnel tests to examine how drone propeller thrust, power, and efficiency change across airspeeds ranging from 0 to 38 mph (0–17 m/s). Read more >>
The experiment demonstrated how propulsion system performance changes under realistic flight conditions, providing critical insights for drone design and development.
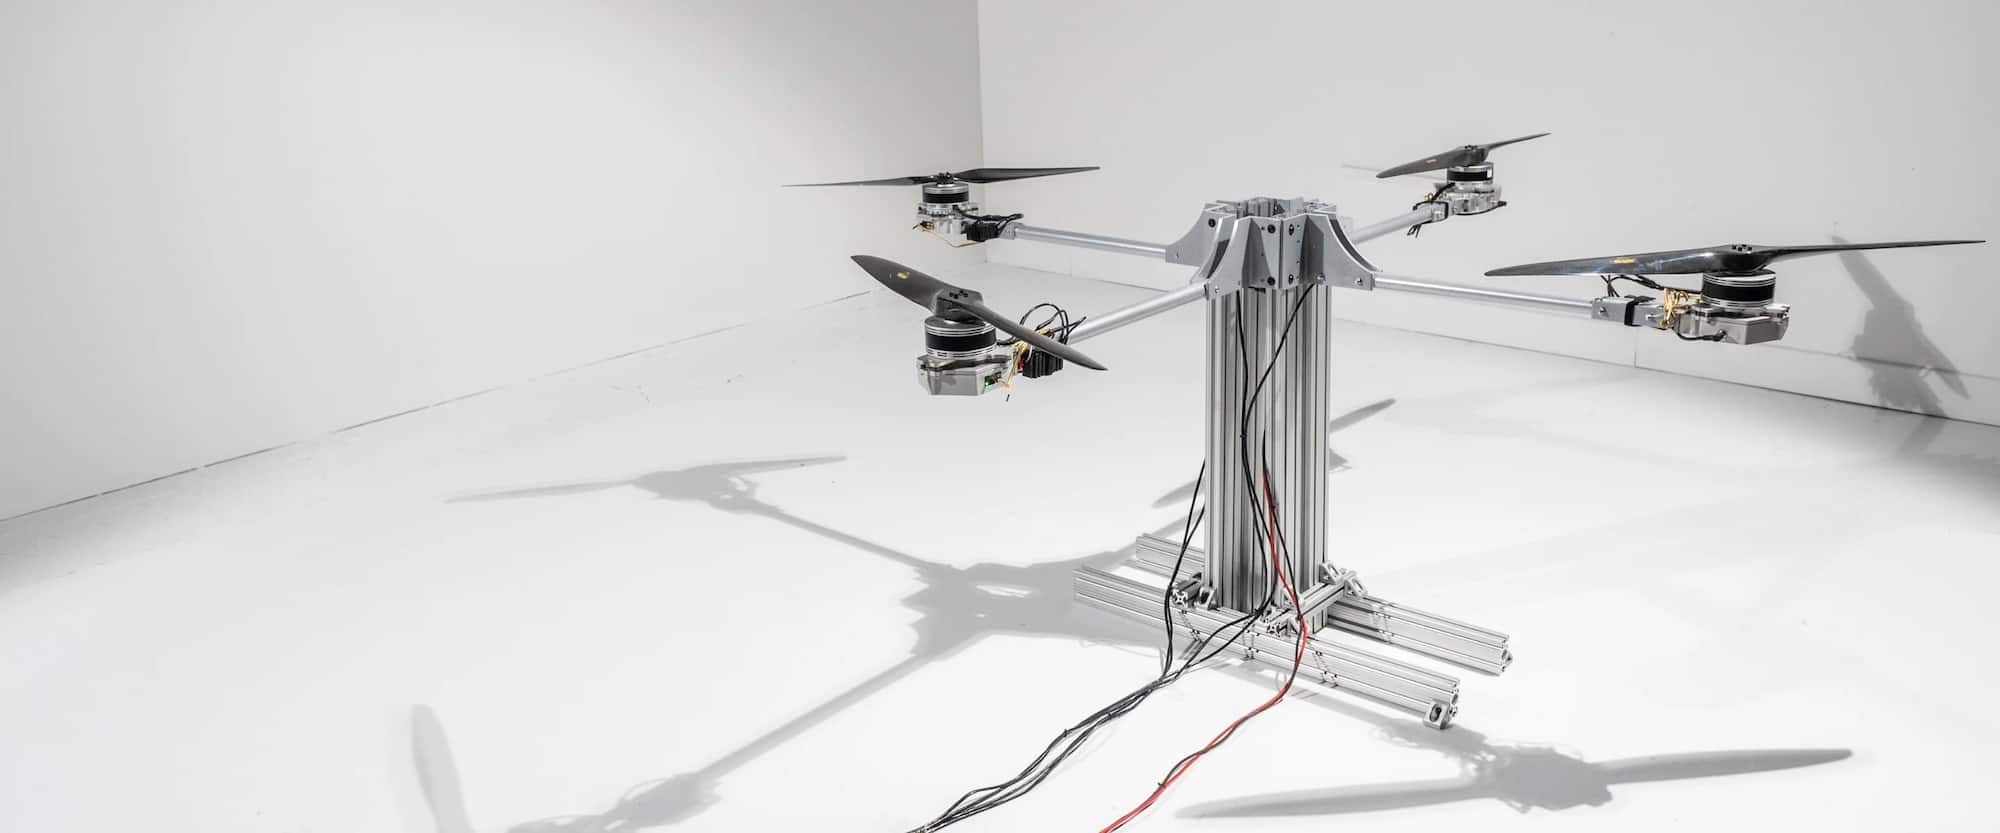
Testing Procedure & Set Up
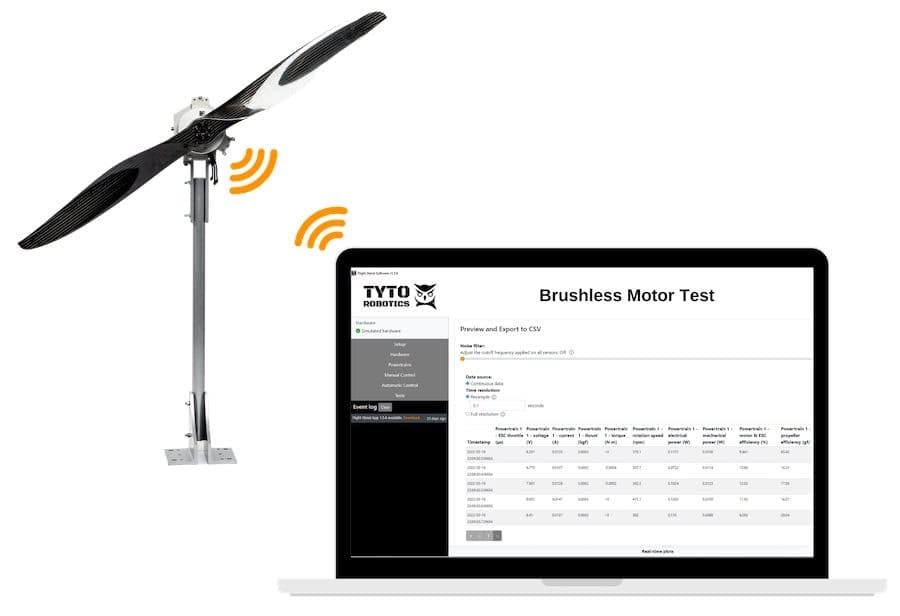
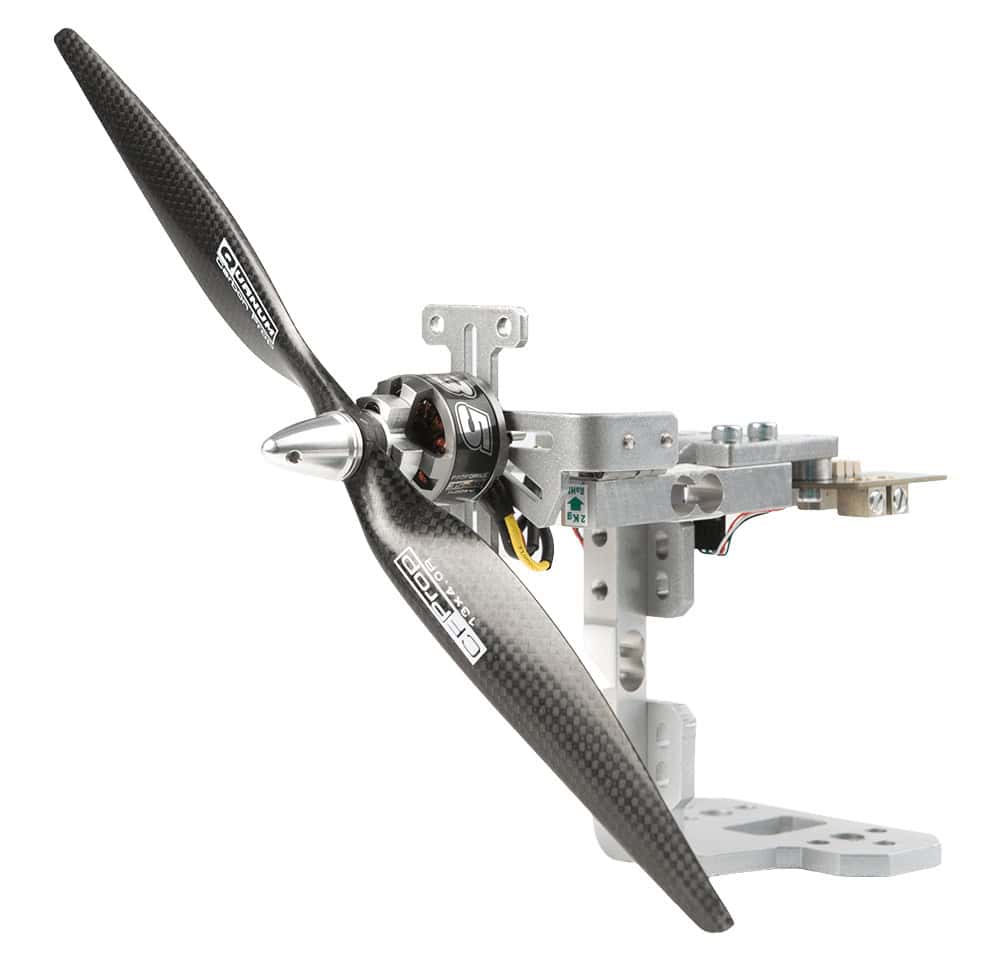
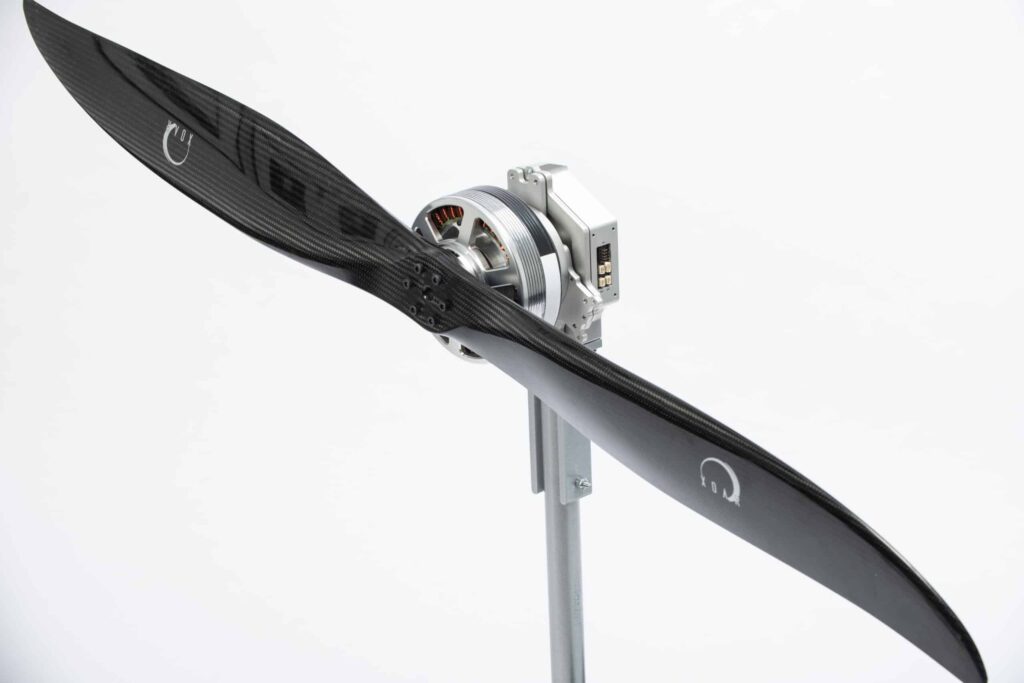
Tyto Robotics used its prop testing station to evaluate a 9” propeller under controlled airflow generated by a 2×2 Windshaper.

The measurement equipment included a 2×2 Windshaper, a modular fan wall producing airspeeds above 16 m/s, with each fan controlled through WindControl software. A series 1585 propeller thrust stand was used, measuring thrust, torque, rotation speed, current, and voltage to derive power and efficiency. Testing was automated via Flight Stand software. An airspeed pressure sensor, connected to a pitot tube, was also utilized to synchronize airspeed measurements with the thrust stand data.
The propeller was installed 210 cm from the Windshaper and tested at four throttle steps: 1550, 1700, 1850, and 2000 µs. Tests were conducted at six airspeeds, including 0 m/s (0 mph), 4.2 m/s (9.4 mph), 7.5 m/s (16.8 mph), 10.7 m/s (24 mph), 14 m/s (31.3 mph), and 17 m/s (38 mph).
Thrust measurements were ‘tared’ by recording baseline readings at 0% throttle at each airspeed and subtracting these from the total thrust values to isolate the thrust generated by the propeller.
Propeller Thrust vs Airspeed
Thrust generation increased with throttle, and was highest in the no wind conditions, but at higher airspeeds, a greater RPM (rotation speed) was required to achieve the same thrust.
For a given thrust, RPM increased as throttle input and airspeed increased, because the incoming airflow pushes against the propeller blades and causes them to rotate faster.
The equation for dynamic propeller thrust demonstrates how propeller forward airspeed relates to thrust generation.
As airspeed increases, the relative airflow vector at the propeller changes. This vector combines the propeller’s rotational velocity and the incoming airspeed. As the forward velocity grows, the angle of attack on the blades decreases, leading to lower thrust generation.
Propeller Thrust-to-Power Ratio
As airspeed increases, mechanical power decreases. Thrust declined more rapidly than power though, with Tyto Robotics showing between 0 and 17 m/s, thrust decreased by 75%, while power lowered by only 19%.
Because less thrust is generated as airspeed increases, while a similar amount of power is drawn, this causes thrust-to-power ratio to decline significantly at higher airspeeds, reflecting lower overall efficiency.
Propeller Efficiency Analysis
Propeller efficiency was calculated using two approaches. The first measured grams of thrust per watt of mechanical power (gf/W), and the second calculated the radio of available power (thrust × velocity) to mechanical power (torque x RPM).
Both methods provided similar results. At lower airspeeds, efficiency declined and plateaued, whilst at higher airspeeds, efficiency increased before stabilizing.
Efficiency could not be calculated at 0 m/s wind velocity using the second method. However, efficiency measured using the second method was useful for calculating airspeeds for a set RPM.
Efficiency curves fitted to the test data showed that efficiency peaks as airspeed increases, then declines as the blades angle of attack lowers. The curves shift right with increasing RPM settings.
To find out more information read ‘Propeller Efficiency at Airspeeds from 0-38 mph’ here >>