

Tyto Robotics, a developer of high-precision testing solutions for Unmanned Aerial Vehicles (UAVs), outlines how a 5-hole pressure probe can measure wind velocity and direction, enabling airflow to be mapped across a defined spatial region. Read more >>
Accurate wind measurement often begins with point sampling, but understanding how airflow behaves across space requires spatially resolved data. Using the WindProbe 3D wind flow measurement and visualization system as an example, the approach combines pressure sensing, position tracking, and visualization to assemble individual measurements into a three-dimensional flow field.

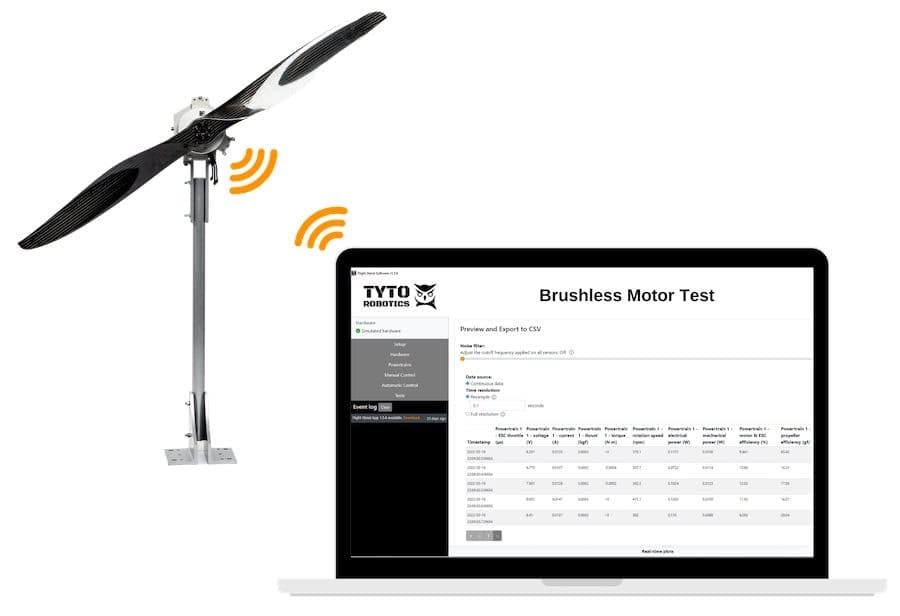
Handheld 5-hole probe.
Flow field mapping involves measuring wind speed and direction across a plane or volume to reconstruct how airflow behaves throughout a region. A multi-hole pressure probe enables this process by measuring pressure at several ports around the probe tip, allowing the local velocity magnitude and flow direction to be calculated at each measurement point.
Because the probe does not require precise alignment with the incoming airflow and provides a compact sensing solution, it is suited to evaluating flow behavior around aerodynamic objects, identifying wakes and flow interactions, comparing experimental measurements with Computational Fluid Dynamics (CFD) data, and analyzing wind velocity distributions.
The WindProbe 3D system integrates four coordinated components to perform these measurements. A 5-hole pressure probe measures pressure, velocity, and flow direction, while a motion capture system tracks the probe’s position and orientation in three-dimensional space. A WindShaper wind wall composed of individually controlled fans generates repeatable and programmable wind conditions. WindVision software synchronizes probe data and position tracking, displaying the resulting wind flow as a real-time three-dimensional flow field that can also be recorded, exported for further analysis, or compared directly with CFD results.
Continuous data acquisition combined with position tracking allows measurements to be recorded while the probe moves through the defined test volume, with each data point assigned to a spatial location.
The WindVision software divides the measurement region into voxels that determine spatial resolution, enabling users to balance measurement detail with acquisition time. Data can be exported as time-stamped CSV files containing raw velocity measurements with coordinates, or as voxel-averaged VTK files suitable for three-dimensional visualization and CFD comparison.
Compared with traditional robotic traverse systems or manual point-by-point measurements, this method enables dense spatial sampling and real-time visualization while simplifying the measurement workflow.
To find out more information, read ‘5-Hole Probe for Wind Flow Measurement (Guide)’ here >>